
Temperature Monitoring
In 2016, the North Coast Watershed Association began an “Adopt-A-Logger” volunteer temperature monitoring program to observe summertime high temperatures in the Youngs Bay and Skipanon watersheds. In 2018, we expanded our monitoring network to include sites in the Nicolai-Wikiup and Ecola Creek watersheds as well.
You can explore the map below to find the data collected at each site or visit the Monitoring Sites page to see a list of sites. Temperature is compared to the ODEQ water quality standard for summertime temperature, which is 18°C for summertime rearing and migration of salmonids. Click pins in the map for more information on each site. Yellow pins represent 2016 sites only, are tidally influenced and potential future sites. Green pins mark 2016-17 monitoring sites. Blue pins are new in 2018.
Why we’re monitoring temperature
Water temperature is a limiting factor for survival of salmon and other cold-water fish. Temperature is also an indicator of the amount of dissolved oxygen in the water – another important parameter affecting the health of all species in the watershed, including us. With continuous, long-term temperature data collection we can assist Oregon Department of Environmental Quality (ODEQ) in establishing Total Maximum Daily Load (TMDL) data, prioritize riparian plantings within our organization, and share this information with the public and other agencies that are working within these watersheds.
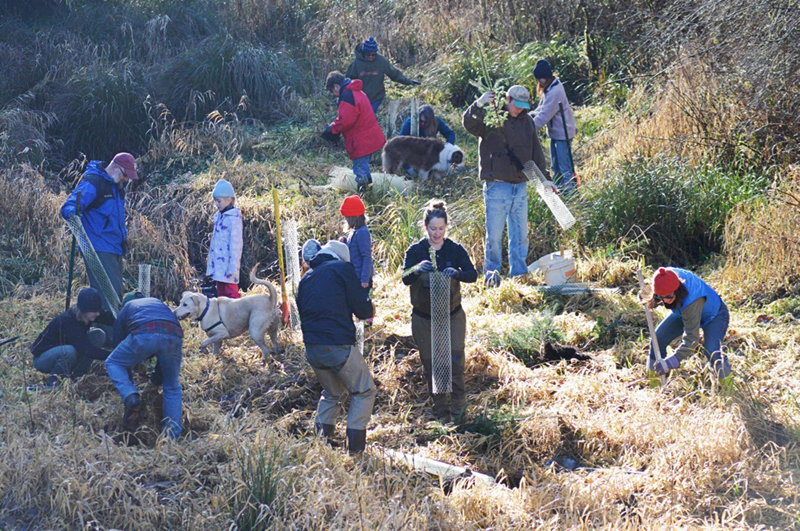
Above: NCWA volunteers and staff plant trees along stream bed. Trees provide cooling shade and habitat for salmon and other species.
No agency currently has multi-year continuous temperature data for the Youngs Bay, Skipanon, or Nicolai-Wikiup watersheds. Oregon Department of Environmental Quality has major data gaps in these watersheds. Without the collection and processing of temperature data within these watersheds, NCWA, DEQ, and other agencies have no way to observe summertime high temperatures, how long they last, and how they vary year to year. Our most basic question is: “do these streams meet the ODEQ water quality standard for summertime temperature?” – which is 18°C for summertime rearing and migration.
All of our data is publicly accessible:
Monitoring data is available for each location on the Monitoring Sites page. Get a quick view of data by navigating the map above (click on push pins to reveal info and graph(s) of temperature data). For a more in-depth look, download the Excel files below.
Download the data here: Download the 2016 Data | Download the 2017 Data